
User Interface
Because the information in a production scheduler is vast and complex, ease of use, responsiveness, and comprehensive functionality of the user interface are indispensable. We provide a top-level operating environment for systems that are used daily in business operations.
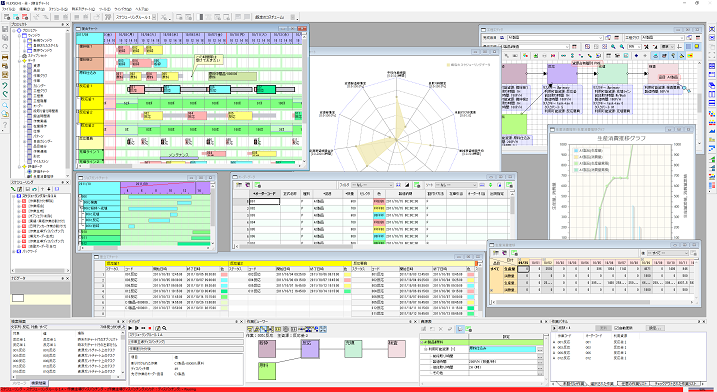
1. Project Panel
Data is arranged in a tree structure, allowing you to edit or drag it to charts. It is also used for various chart operations, snapshots, and editor options.
2. Scheduling Panel
You can quickly open the scheduling rule setting dialog or execute scheduling.
3. Resource Gantt Chart Row
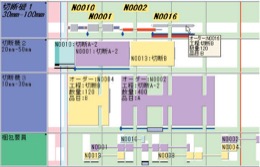
Displays the sequence of operations using each resource. You can smoothly make manual corrections by dragging operations to any time or resource. It is the central chart row of the user interface.
4. Process Editor
You can quickly edit the network of processes with intuitive drag-and-drop operations.
This is a feature of the FLEXSCHE Editor (optional product).
5. Evaluation Chart
Numerically evaluate scheduling results from various perspectives and display them in a radar chart. It also supports the snapshot function.
This is a feature of the FLEXSCHE GUI Extension (optional product).
6. Chart Window
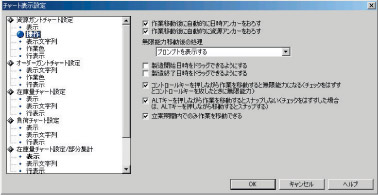
Freely combine various chart rows on the vertical axis with a timeline on the horizontal axis. You can smoothly scroll/zoom in/out using the mouse wheel. You can freely configure rows by dragging and dropping resources or items from the project panel. The display content and operation methods can be specified in various ways through display settings. Additionally, by registering these as styles, you can quickly display charts from various perspectives. It also has advanced printing functions such as margin settings, advanced header/footer formatting, monochrome printing mode, and composite printing.
7. Inventory Chart Row
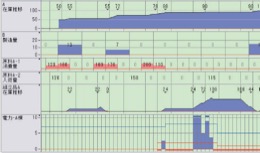
Displays the transition of theoretical inventory levels of items and aggregated values per unit time. It can also aggregate multiple items.
8. Order Gantt Chart Row
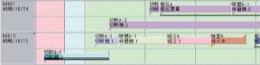
Displays a series of operations belonging to an order in a timeline. It allows easy understanding of the relationship between process stagnation and due dates.
9. Data Editing Window
Almost all data can be edited within FLEXSCHE.
This is a feature of the FLEXSCHE Editor (optional product).
10. Navigation Panel
Displays the scroll position of the window, allowing you to quickly scroll to any location with mouse drag operations.
11. BOR Editing Panel
Edit resources available in each process and their capacity values.
This is a feature of the FLEXSCHE Editor (optional product).
12. Operation Viewer
Graphically displays the network structure or task structure of operations clicked on the Gantt chart. Conversely, you can also locate operations displayed from the Gantt chart.
This is a feature of the FLEXSCHE GUI Extension (optional product).
13. Operation Panel
Displays a list of unassigned operations or selected operations. The display content can be customized through settings. Operations can be manually assigned by dragging and dropping them onto the Gantt chart.
14. Load Chart Row
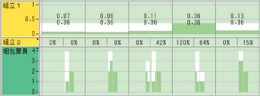
Displays the load rate or load amount per unit time of resources.
It can also aggregate multiple resources.
15. Job Gantt Chart Row
Displays complex project-type processes in a hierarchical view.
16. Costume Function
Switches the display settings of each chart row (multiple patterns prepared in advance) in bulk.
17. Debug Panel
Interrupt scheduling according to conditions, allowing you to observe watch expressions and charts, which facilitates debugging of scheduling rules.
18. Search Result Panel
Search and list any conditions from anywhere within FLEXSCHE. You can quickly jump to the relevant location from the item.
19. Graph Window
Aggregate the vast data within FLEXSCHE from any perspective and generate graphs.
20. Window Separation Function
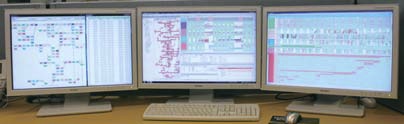
By detaching internal windows from the main window and freely arranging them, you can efficiently view and operate a large amount of data in a multi-monitor environment.