
Unearthing valuable indicators from scheduling data
FLEXSCHE Analyzer
FLEXSCHE Analyzer
The production scheduler can be considered a highly modeled virtual factory, and the various data accumulated there is truly a "treasure trove." By analyzing various indicators extracted from it from multiple perspectives, valuable information for the manufacturing industry can be obtained. This is not only useful for planning operations but also greatly aids in management decisions. FLEXSCHE Analyzer provides the means for this.
FLEXSCHE Analyzer can be utilized in the following scenarios:
- Analyze long-term equipment utilization rates and on-time delivery rates to aid in investment decisions
- Analyze fluctuations in inventory levels and demand to evaluate the appropriateness of safety stock levels set for each component
- Meticulously aggregate manufacturing costs and production lead times for each item to reflect in product mix planning
- Analyze setup occupation rates and equipment utilization rates to aid in on-site improvements
- Quantify delays and waste in processes to aim for better planning
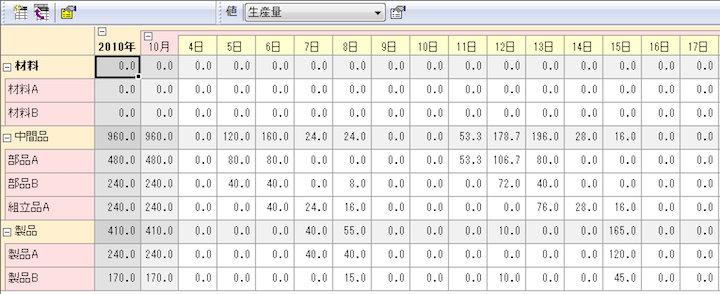
In FLEXSCHE Analyzer, the first step is to collect data within FLEXSCHE and generate a "Data Cube (hierarchically structured multidimensional data)." The method for generating the Data Cube is freely defined by the user using the "takt expression." In the "Data Cube Viewer," which is used to view the generated Data Cube, you can specify the axes to be displayed and open or close the data hierarchy, allowing you to efficiently grasp vast amounts of information from multiple perspectives.
* Additionally, instead of a Data Cube, you can generate a dataset (table-form data) to reference from scheduling rules or export to a file.
Furthermore, you can specify any axis and range from the Data Cube to extract values and create graphs. The following types of graphs can be created in FLEXSCHE Analyzer:
- Line Graph
- Vertical Bar Graph/Horizontal Bar Graph
- Pie Chart
- Bubble Chart
- Scatter Plot
- Radar Chart
You can easily create radar charts (referred to as "evaluation charts") for the following evaluation indicators that are provided as standard.
You can also overlay multiple scheduling results, which can be used for tuning scheduling rules.
- Average Operation Time
- Average Changeover Time
- Total Changeover Time
- Number of Unassigned Operations
- Number of Overdue Orders
- Average Due Date Margin Time
- Average Production Lead Time
- Number of Changeover Occurrences
- Average Production Shipping Lead Time
- Average Simple Idle Time
- Total Overdue Time
- Total Operation Time
You can freely rewrite this as a basis.
Since graphs are created as HTML5 files, they can also be viewed in a web browser.