
Share the latest Gantt chart with everyone without incurring costs
FLEXSCHE WebViewer
FLEXSCHE WebViewer
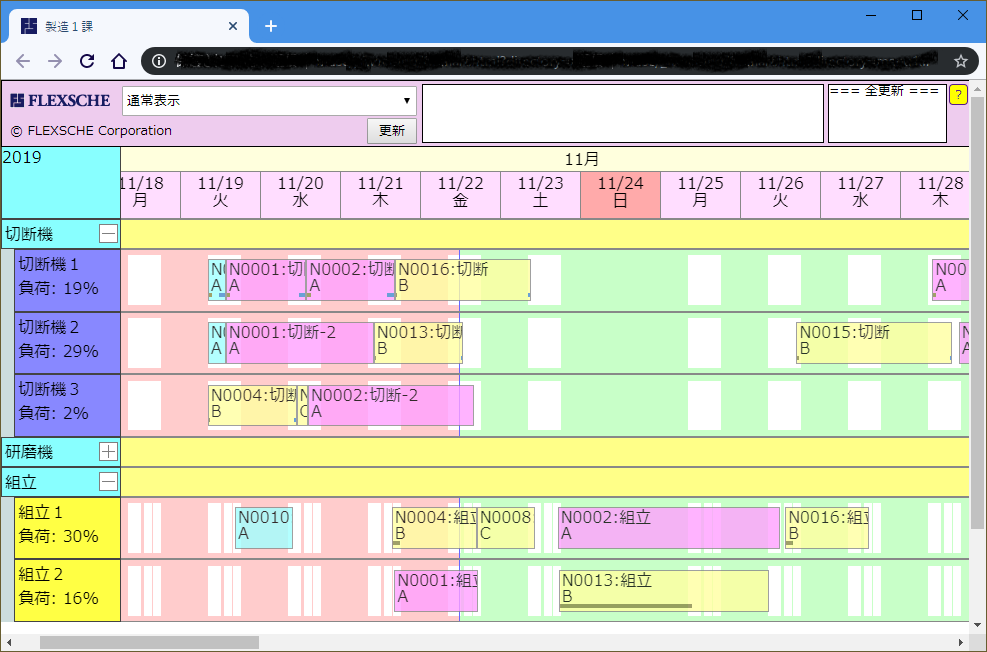
FLEXSCHE WebViewer Screen
As a method to present the results planned by the production scheduler to the manufacturing site, it is often a local "work instruction" for individual workers or each piece of equipment. However, there may also be a desire to use Gantt charts to get an overview of the entire operation. It is also required that managers (such as headquarters or plant managers) and the sales department can grasp the factory's situation at any time.
Traditionally, for such needs,FLEXSCHE Viewerwe have provided this. It is equipped with advanced screen display functions at the same level as FLEXSCHE GP used by planners, enabling visualization of plans from various perspectives. However, since a license must be prepared for each client, the cost increases as the number of clients increases, which was a drawback.
As another means, we offerFLEXSCHE WebViewer(abbreviated as FWV). FLEXSCHE WebViewer is a simple Gantt chart viewer that operates on a web browser. The information that can be displayed and the functions that can be performed are limited, but it is a product that meets the demand for "just a simple overview."
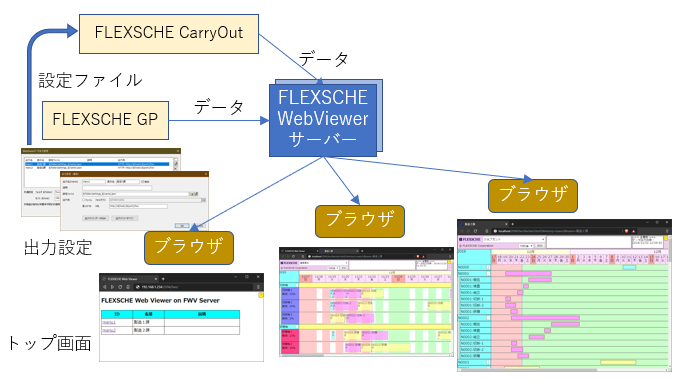
FLEXSCHE WebViewer is available for free, but only data output from aFLEXSCHE GP、FLEXSCHE Communicator with GPvalid maintenance contractFLEXSCHE CarryOutor license can be displayed.
Output of WebViewer Data
Set the output method to FLEXSCHE WebViewer on FLEXSCHE GP with a valid maintenance contract and perform the data output process. By placing the created configuration file on FLEXSCHE CarryOut, data can also be output from FLEXSCHE CarryOut.
The strings, colors, and chart row configurations displayed in the Gantt chart can be defined using the familiar expressions in FLEXSCHE. Chart rows can also be hierarchically structured in a tree format.
FLEXSCHE WebViewer Server
You can place the output data on a general web server to view it with FLEXSCHE WebViewer, but by operatingFLEXSCHE WebViewer Serverwithin an intranet, you can push data to the browser every time it is updated.
The operating environment for the WebViewer server does not depend on the OS type as long as Node.js is running.
FLEXSCHE WebViewer'ssample screencan be viewed. However, since the FLEXSCHE WebViewer server is not running, the push distribution function of updated data cannot be confirmed here.
For instructions on how to operate the chart, click on the?at the top right of the chart screen.
The supported browsers are Google Chrome, Mozilla Firefox, and Safari. As for Microsoft Edge, operation has been confirmed for version 79 and later (Chromium version), but earlier versions are not supported, and some features, such as drawing operation connection lines, may not be available.