
Significantly expand the user interface of the planning environment
FLEXSCHE GUI Extension
FLEXSCHE GUI Extension
The FLEXSCHE GUI Extension is an optional product to enhance the functionality of the user interface.
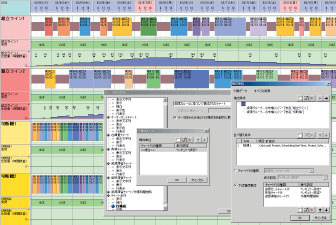
Snapshot Function
You can save the entire data to a single file at any arbitrary timing and restore it with simple operations. You can display and compare multiple schedules created under various conditions side by side, and easily manage data versions. You can also freely choose which snapshot to display for each chart row.
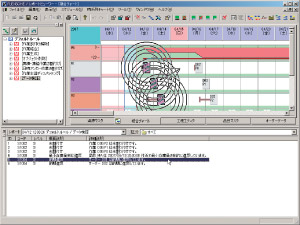
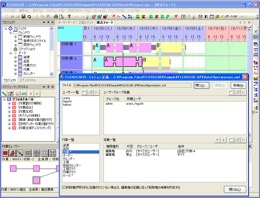
Operation Viewer
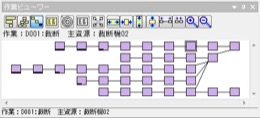
Graphically display the task structure of operations, the network of operations, and the hierarchical structure of split operations. It works in conjunction with various parts of the user interface, including the resource Gantt chart, and conversely, you can locate operations displayed in the Operation Viewer from the Gantt chart (radar pointer display). You can customize the displayed text information using format strings.
Operation Sequence Chart
This is a table-format chart for adjusting the order of operations on each resource. You can drag cells representing operations with the mouse to change the order of operations on the resource or change the assigned resource for operations.
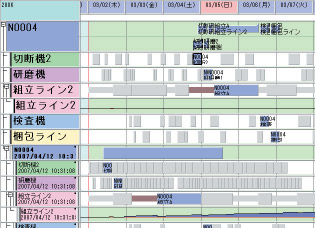
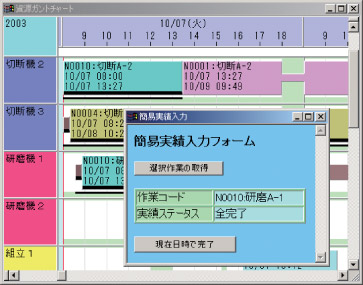
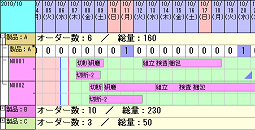
Job Gantt Chart Row
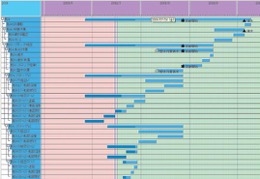
This is a chart for hierarchically visualizing large-scale processes such as heavy industry or large equipment manufacturing. It drills down from large schedules to small schedules in a tree structure according to the structure freely defined in the process hierarchy table.
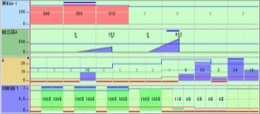
Idle Chart Row
Visualize the idle status between processes from various perspectives. There are "Resource Idle Chart Rows" that target idleness before and after resources, and "Item Idle Chart Rows" that focus on the idleness of each item. They serve as valuable guides for obtaining optimal scheduling results.
Format String Editor
Edit the content of strings displayed inside charts.
Since it can be edited with intuitive operations centered on drag & drop, you can easily assemble the display content without referring to the online manual.
Evaluation Chart
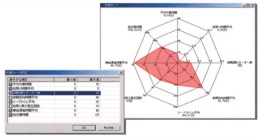
Numerically evaluate scheduling results from various perspectives and display them in a radar chart. It also supports the snapshot function.
Data Output for FLEXSCHE Viewer
Output data for FLEXSCHE Viewer. By transferring schedule data to a web server, you can refer to the schedule results via the internet or intranet.
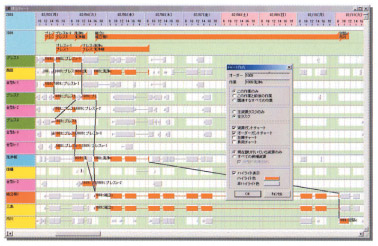
Automatic Row Configuration Function of Chart Window
Automatically configure the arrangement of chart rows based on defined rules. There are simple methods to select pre-prepared rules and advanced methods to finely and freely describe extraction conditions and display order using conditional expressions and evaluation expressions. You can quickly and automatically obtain chart displays that always follow the ever-changing data.
Chart Row Hierarchization Function
By hierarchizing chart rows into a tree structure, folding and grouping become possible. You can freely control the hierarchical structure using various "row insertion" functions, popup menus, and middle mouse button operations. The range of applications expands when combined with the snapshot function and automatic row configuration.
Long-term Plan Support Display
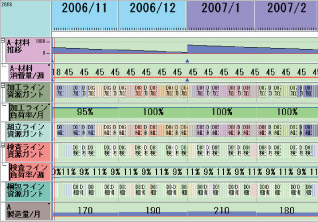
You can switch the horizontal axis of the timeline chart, which was previously on a daily basis, to a monthly basis. Additionally, the aggregation period of load charts and inventory level charts can be set to weekly or monthly units, in addition to hourly or daily units.
Report Viewer
Reports output by methods such as the Validate Data Method are presented in an easy-to-read manner. There are features such as jump functions to the Gantt chart and filtering display functions by category.
Chart Creation Assistance Function
These are various functions to easily create related composite charts based on the currently displayed chart. For example, you can expand and display operations derived from a specific order in the order Gantt chart on the resource Gantt chart. You can also highlight specific operations.
Display Color Specification by Expression
By freely defining the display color of text on charts, operations, and the left section of charts with expressions, the expressive power of the chart is enhanced. Transparent colors (i.e., non-display) can also be specified.
HTML5 Embedding Function
From scripts within web pages loaded into FLEXSCHE, you can access all objects of FLEXSCHE. You can build dynamic applications using the latest web technologies, not just display web pages.
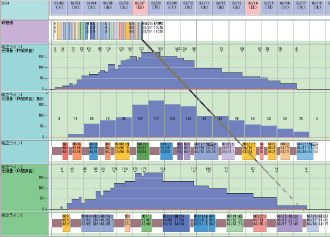
Load Chart Configuration Display
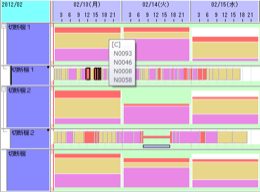
Group and color-code the operations that constitute the load for display. The classification method can be flexibly defined from various perspectives. By clicking on each group, you can check and operate the breakdown in the operation panel.
Chart Sticky Note Function
You can attach sticky notes (memos) to specific times or operations on the timeline chart for display or printing. The content of the sticky notes can also be linked to the comment strings of operations.
Permission Management Function
When a user attempts to perform various operations on FLEXSCHE, the system automatically determines whether the current user is permitted to perform that operation on the data based on the permission definitions, and if not permitted, prevents the operation from being performed.
Level Display
Draw lines representing minimum, standard, and maximum levels on inventory level charts, load charts, and idle charts, and display warnings where values fall outside the range. You can define multiple patterns of levels that change according to the time range and switch between them.
Signboard Row
It is a versatile chart row that can be used as a means to organize and display timeline charts hierarchically, or to display arbitrary information using formulas, allowing for flexible chart configuration. It can be used for various purposes, such as displaying and operating task segments in the workshop or displaying values from a data cube.→Feature Introduction
The features of the FLEXSCHE GUI Extension are continuously expanding.