FLEXSCHE Version 16
FLEXSCHE Version 16.0 was released on June 21, 2016. It includes approximately 250 feature enhancements. Here are some of the main ones. (Differences between Version 15.0 and Version 16.0)
【New Product】FLEXSCHE Workshop Option (Workshop Planning Option)
A groundbreaking new product that addresses "interference of placement of manufactured goods" which previous production schedulers could not handle.
For manufacturing large-scale products ranging from several meters to several tens of meters, interference in placement in the workshop is an important issue. The "Workshop Planning Option" is an optional product that allows for automatic scheduling and manual planning while considering the placement of items as constraints.
Definition of Shape
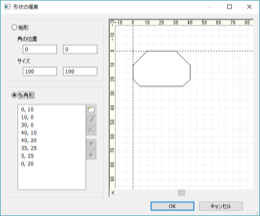
You can graphically define the shape of the workshop and the shape of the manufactured goods (workpiece). The shape of the workshop is defined by rectangles and exclusion areas (entrances, columns, passages, etc., unusable parts). The shape of the manufactured goods is a polygon.
Of course, it can also be imported as data from external sources.
Visualization of Workshop
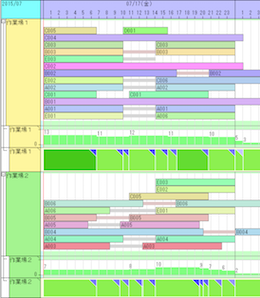
The layout of the workshop and manufactured goods at a certain point in timeis displayed on the Workshop Panel.You can move and fix the manufactured goods by dragging with the mouse, or rotate them.
When you move the mouse cursor or click on the signboard row [Task Segment Display] placed on the timeline chart, the state of that time period is displayed on the Workshop Panel. The signboard row also displays the occupancy rate and violation status for that time period.
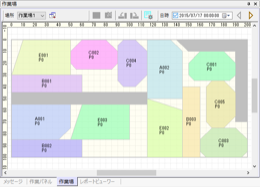
Planning of Workshop
By using the shape of the manufactured goods (workpiece) and the state of the workshop as constraints, you can schedule so that the manufactured goods do not overlap each other and fit within the workshop. Furthermore, you can move and fix the manufactured goods with mouse operations, or if necessary, deliberately create a state where they overlap each other and schedule while maintaining that state.
Output of Workshop Planning to External Sources
There are various ways to output the results planned with the Workshop Planning Option to external sources. By using FLEXSCHE EDIF, you can export the data to databases or CSV files. At that time, you can also output graphic data in EMF or SVG format, which can be imported and utilized externally.
FLEXSCHE Analyzer'sExcel Report Functioncan be used to output reports including drawings of layout diagrams. Alternatively, you can use an external method on FLEXSCHE to process the SVG files output by FLEXSCHE EDIF and display or output them as web pages (HTML files).
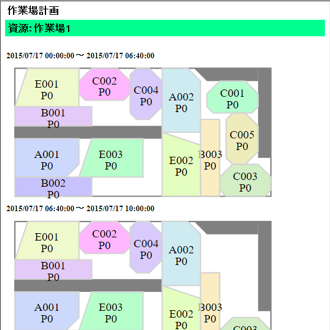
Output to Web (HTML)
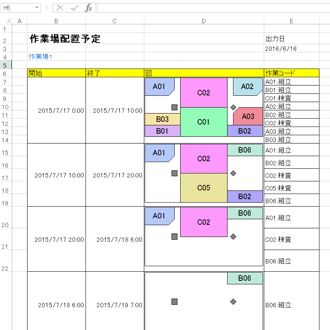
Output as Excel Report
【New Product】FLEXSCHE CarryOut
While previous FLEXSCHE only performed 'planning', the new product FLEXSCHE CarryOut goes a step further to also support 'execution of plans'.
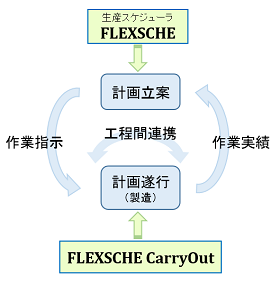
The value of a manufacturing plan devised by a scheduler is maximized only when it is properly executed on the manufacturing floor based on it. However, work on the manufacturing floor does not always proceed as planned.
'Checking the status of work and progress in real-time, collecting results, and passing that information to the scheduler to re-plan with the results reflected'... Supporting the high-level realization of such a natural planning operation cycle is the mission of the new product FLEXSCHE CarryOut.
FLEXSCHE CarryOut is a product set with a server and a client.

CarryOut Clientは、iOS/Android/Windowsis an app that runs on a tablet device. This appcommunicates with the CarryOut Serverto fetch and display the latest work instruction information sent from FLEXSCHE, and send the entered work result information to FLEXSCHE via the CarryOut Server.
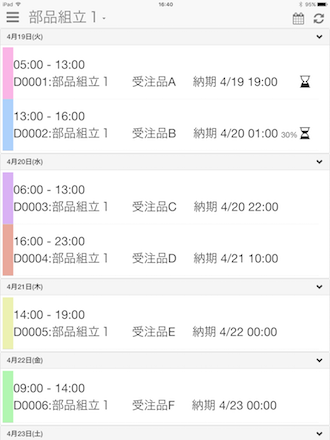
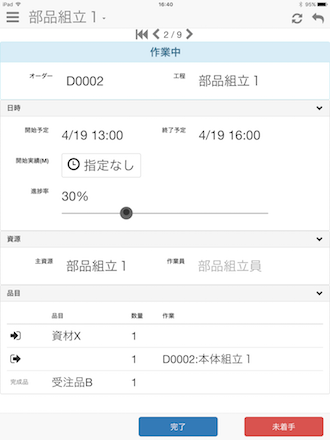
Screen Image of CarryOut Client
In future releases of FLEXSCHE CarryOut, it will evolve into a front-end system indispensable for smooth plan execution on the manufacturing floor by sharing progress and trouble information inside and outside the factory, removing temporal and spatial barriers, so please look forward to it.
User Interface
Startup Screen
Managing and handling created projects and sample data becomes easier.
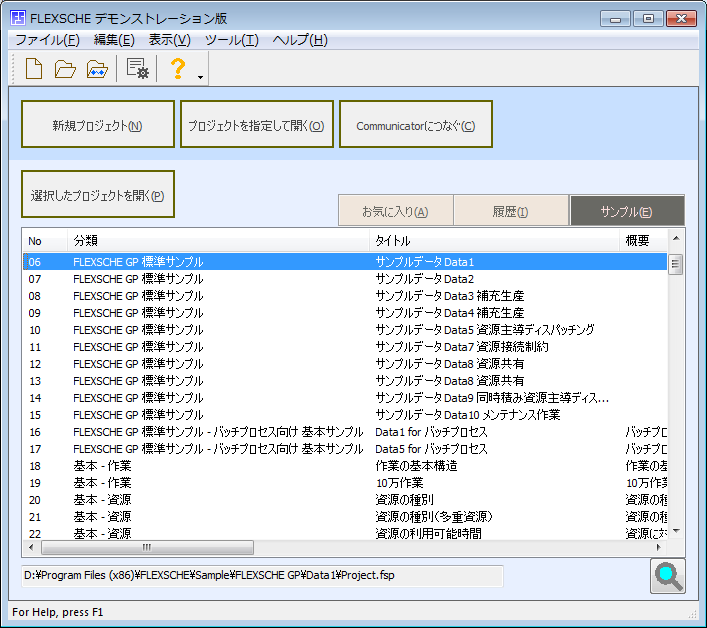
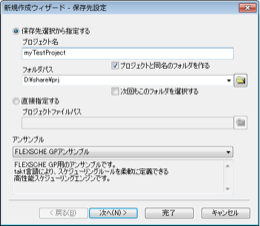
The startup screen is now displayed immediately after launching FLEXSCHE. You can quickly specify the desired project from categories such as history, favorites, and samples. You can also perform text searches by name or comment.
Additionally, a wizard screen can be used for creating new projects. The automatic folder creation function and history function make it easy to specify the project save destination.
Stored Variables
When defining the drawing content (strings, colors, etc.) of a chart with expressions, there may be cases where the drawing speed can be dramatically improved.
When you define strings or colors to be drawn on a chart using expressions, the same calculation may be repeated over and over (hundreds or even thousands of times) to render a single screen. For example, to achieve "compare the total operation time of orders and draw only the top three in a noticeable color," you would set the condition for operation display color as "examine all orders and operations, create a sorted order list, and change the color if the order of the operation to be drawn matches any of the top three in the list." However, performing this process every time an operation is drawn results in an enormous amount of calculations in total.
Therefore, by calculating the "sorted order list" common to all operations only once when updating the chartStored Variablesand storing it, you can dramatically reduce the amount of calculations by referring to it during the drawing of each operation.
Additionally, by using stored variables, you can retain values calculated during automatic row configuration for each chart and chart row, and refer to them within the variable scope. This allows you to create more flexible and effective charts than before by combining with action functions.
Time Offset Specification for Chart Rows
It has become possible to create such special charts.
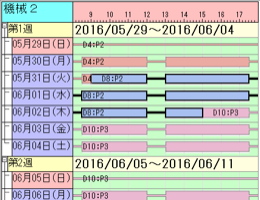
It is now possible to draw with time shifted for each chart row. By utilizing this feature, you can create special charts that were previously impossible to create. For example, by arranging resource Gantt charts vertically with time shifted daily/weekly/monthly, you can grasp long-term plans on a single resource at a glance without scrolling.
Function Expansion of Signboard Rows
The functionality of signboard rows, which was introduced as a new feature in version 15, has been further enhanced.
◆ Generic Signboard Rows
It has become possible to create signboard rows from integer, real number, string, time, and date-time values without relying on existing records (items, orders, resources, processes) as before. This allows for even more flexible chart creation.
◆ Output of Displayed Data
Values calculated in signboard rows can now be output as aggregated data in csv or xml files, similar to load charts and inventory level charts.
◆ Layer Selection for Data Cubes
Previously, the values of data cubes that could be displayed in signboard rows were only related to the lowest layer, but now you can freely specify the target layer. This allows you to display aggregated values for layers such as "month," "week," "year," and resource groups.
◆ "Mesh" and "Start Day" in "Expression" Display

In the "Expression" display of signboards, you can now freely choose the mesh to calculate and display from "day," "week," and "month." You can also specify the start day of the week and the start day of the month.
Enhancement of Load Chart Configuration Display
You can view the "breakdown" of operations from various perspectives.

Display so that one operation becomes one component
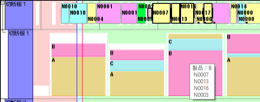
Define components by product, and include
Display a list of orders in a data tip
The configuration display of load charts not only shows the load of resources but also color-codes and displays its breakdown. In version 16, it has become possible to freely define strings to be displayed on each component (each breakdown). The way to determine this "breakdown" can be freely defined from various perspectives such as product, specification, and any attribute (expressions can also be used), but in version 16, the method has become more sophisticated and clear.
When you click on a component, the operations included in it are selected, allowing you to check and operate the details from the operation panel, etc.
Multi-tier Display of Job Gantt Charts
It can be utilized for comparison of plans and actuals.
It has become possible to display various operations/operation graphs on a single row in job Gantt charts. This allows you to compare the state of plans and actuals for each operation and order.
* Although it was possible to compare plans at multiple points in time using snapshots, the timing of confirming plans and actuals for each operation and order differs, so snapshots alone were insufficient for comparing plans and actuals.
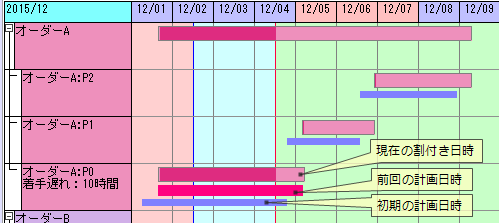
What can be displayed are
- Current assigned date and time
- Planned date and time
- Any recorded date-time value (keyed date-time value)
- Date and time recorded in snapshots
These four types.
Daily Display of Operation Sequence Charts
Operation sequence charts have become easier to use as work instruction sheets.
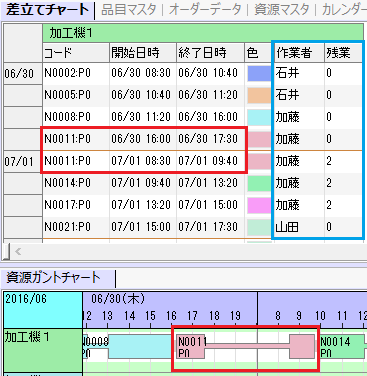
When displaying operation sequence charts divided by period, it has become possible to display operations that span the division in all periods. This means that operations not completed the previous day are listed at the beginning of the next day. At that time, the start and end date-times of the operation are displayed as the start and end date-times of that period.
Additionally, it has become possible to refer to variables such as $_row and $_day in places where expressions for display strings can be used. By using these variables, you can, for example, display on the operation sequence chart whether it is overtime that day.
Change the height of resource Gantt chart rows according to the number of piled-up tasks
You can make piled-up tasks easier to see.
In cases where the number of tasks stacked differs for each chart row, tasks used to become thin and hard to see. Although it was possible to change the height of rows individually, it required setting and operation for each row.
With this new feature, it has become possible to automatically change the height of rows according to the number of tasks stacked.
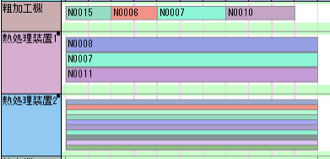
When aligning the height of chart rows and changing the height of tasks
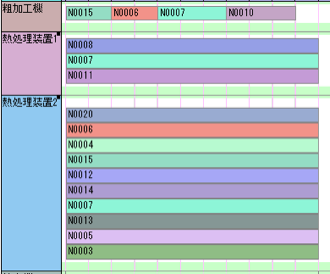
When aligning the height of tasks and changing the height of chart rows
Other Enhancements to Chart Drawing and Operation
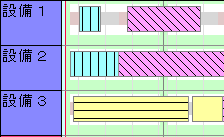
Hatch patterns on operations in Gantt charts
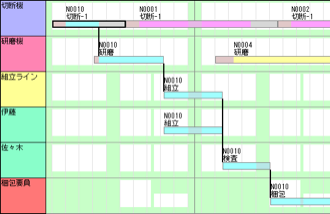
Draw task bars thinly
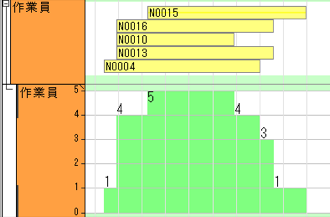
Numerical display of resource quantity in unaggregated load chart display
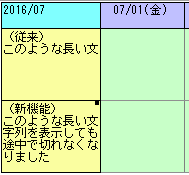
Draw task bars thinly
Function Expansion of FLEXSCHE Editor
● Change of Column Display Name in Tables
It has become possible to freely specify the names of table columns. You can set familiar item names. The original names can be checked in the data tip.
● Separation of Selector Fields
Flags could be separated into fields as before, but now selectors for orders and items can also be separated similarly. This allows for more efficient operation of selectors on the screen.
Scheduling and Modeling
Process Skip
It is easy to omit intermediate processes by specifying from orders. This allows you to express various variations while reducing the effort of process definition.
Even for the same product, there may be cases where intermediate processes are omitted due to differences in specifications. If you enumerate the combinations of possible omissions and define process graphs for each number, the effort and data volume will become enormous. In conventional FLEXSCHE, it is not impossible to consolidate into one process graph using link selectors, but the complexity of the data increases, making maintenance difficult.
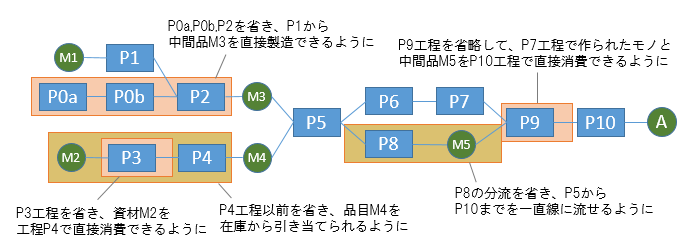

Process SkipBy using this, you can pre-mark potential omission points within a single process graph and easily toggle processes on or off using a selector. When combined with the field separation feature of the order table selector in FLEXSCHE Editor, the On/Off operation becomes even simpler. In make-to-order production, for example, if you predefine a few basic process patterns (process definitions), you can operate by simply omitting intermediate processes and aggregating the expected operation times for each process into the order when receiving an order.
The "mark" can be defined in detail according to the purpose, such as which settings to retain on the input or output side when skipping.
Automatic Lot Pegging Method
It is now possible to perform more flexible automatic pegging than before.
This is a new pegging method that enhances the conventional "Automatic Order Pegging Method." You can specify the priority order when pegging or limit the pegging counterpart based on conditions. For example, you can peg in such a way that it does not span multiple supply lots for objects that can be cut but not combined.
To use this feature, the advanced option "Order Pegging Automation" must be enabled.
Resource Limitation and Operation Period Restriction in Operation Graph
Connects macro scheduling and micro scheduling.

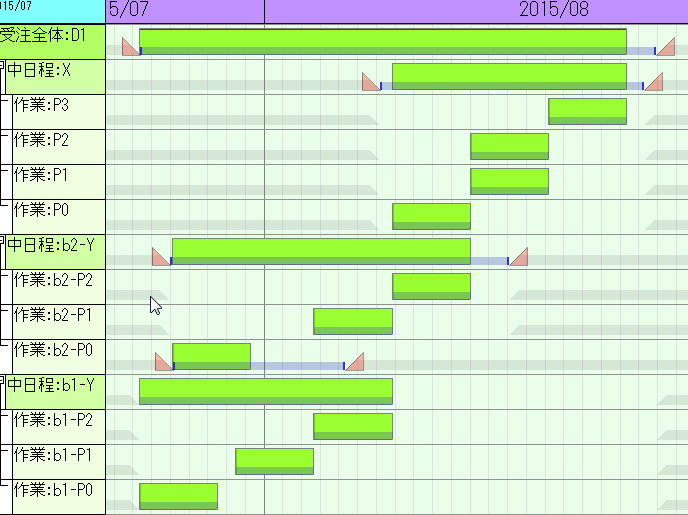
Added "Resource Limitation" and "Operation Period Restriction Start/End Time" fields to the operation graph. You can collectively restrict the assignment time range and resources for multiple operations belonging to the operation graph.
When planning macro schedules, this feature is useful for roughly narrowing down the timing and location (factory, building, etc.) for a series of operations, and then planning within those constraints in micro scheduling.
Operation period restrictions can be edited with the mouse on the job Gantt chart.
Make operation time and resource quantity inversely proportional
The "height" changes on the spot according to the "length."
It is now possible to inversely proportion the required resource quantity (such as the number of people involved) in real-time when changing the operation time. The inverse proportional relationship between time and resource quantity could previously be expressed with "Variable Capacity Resource," but from version 16, by setting a special key "#mwvr" (Manufacturing Time Adjustment Ratio) in the BOR,Required Resource Quantity Calculation Link Keyyou can change the task resource quantity (height in the load chart) in real-time when stretching or shrinking the operation time on a normal multiplex resource (not variable capacity) using mouse operations, etc.
FLEXSCHE EDIF (Data Interface)
Iteration Variable
The flexibility of importing data from existing systems has further improved.
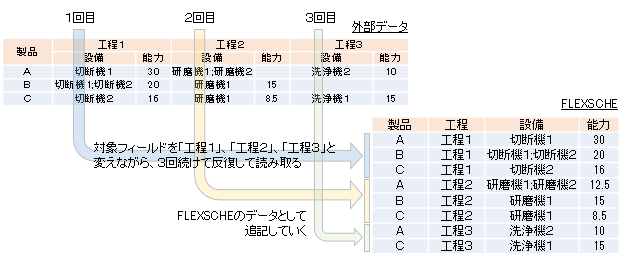
One record in the database of an existing system in a factory may correspond to multiple records in FLEXSCHE. For example, in the case of process data, one process becomes one record in FLEXSCHE, but in existing data, data for multiple processes per product may be consolidated into one record.
The technique for reading such data with different table structures is "iterative reading." It involves repeatedly reading while changing some of the target fields and appending to FLEXSCHE.
However, previously, the target fields for table mapping (which defines the correspondence between fields on the reading side and the writing side) were fixed, so you had to define table mapping for each repetition. Implemented in version 16,Iteration Variableallows you to prepare just one table mapping and automatically change the target fields given to the variables while iteratively reading. This will significantly improve the workload for defining and maintaining mappings.
Column Specification by Column Number
Data can now be imported seamlessly even from CSV files without header rows.
The flexibility of import definitions from CSV files without header rows has greatly improved. You can now specify the Nth column field with a special field name "#i.N". Additionally, you can specify the column number (integer value) as an argument for the Field function.
Exclusive Processing for CSV File Reading and Writing
It is safe even if reading and writing are done simultaneously.
If there is a process already writing to the file during CSV file import, or if there is a process already referencing the file during export, it will wait. If the waiting time exceeds the timeout setting, it is considered an error.
Add Calculation Formula Field to Field Group
You can increase the amount of information in the operation instruction information.
When exporting "field groups" that bundle multiple fields such as input/output links and task information in the operation table, it was previously not possible to write out additional information (such as comments on raw materials or numerical specifications of sub-resources). However, you can now write out these as field values by describing calculation formulas.
FLEXSCHE Analyzer
Snapshot Type Dimension
You can compare evaluations of multiple simulations.
As a data type for dimensions,Snapshot Typehas been added. You can compare evaluated values of multiple snapshots (states of simulations or planned schedules) from any perspective. Of course, you can also visualize them as graphs.
User-Defined Items in Evaluation Chart
You can incorporate your own evaluation criteria into the evaluation chart.
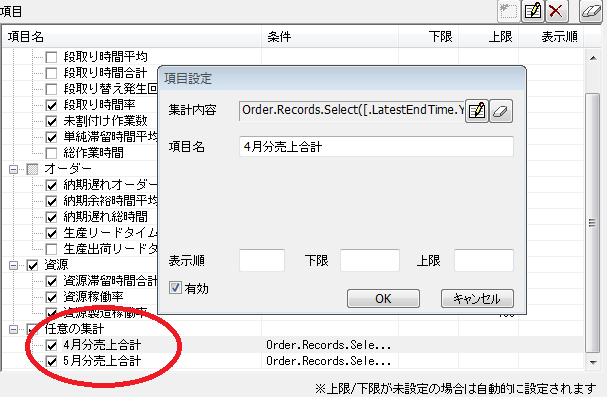
It is now possible to add definitions by calculation formulas as evaluation items in the evaluation chart.
For Developers
Independently Generate Data Cubes Regardless of Generation Definitions
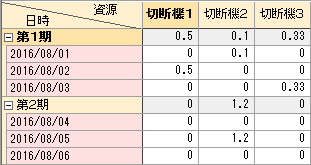
It is now possible to add and generate data cubes from add-ins, etc. You can create data cubes in a unique way different from the generation definitions provided by FLEXSCHE, and display them in the data cube viewer or signboard rows, or generate graphs.
Display Implementation Example
Example of Add-in Code (JavaScript):
				function _GenDC( keyEntity )
				{
				  var project = keyEntity.ParamObject( FLEXSCHE.ParamIDProject );
				  var ensManager = project.EnsembleManager
				  // Please prepare the evaluation data settings (data cube) in advance and set its GUID.
				  clusterID = "DDD798B175B64430B008FFEA02F0E3B8"
				  dcName = "sample"
				  // Search for the data cube node (create if it doesn't exist)
				  dcID = ensManager.DatacubeGuidByName( dcName )
				  var dc = ensManager.Datacube( dcID )
				  if( dc == null ) {
					dcID = ensManager.AddDatacube( clusterID )
					ensManager.DatacubeName( dcID ) = dcName
					dc = ensManager.Datacube( dcID )
				  }
				  // Construct the data cube
				  UpdateDatacubeA( dc )
				  // Display the data cube viewer
				  var dcEditor = ensManager.ShowDatacube( project, dcID )
				  ensManager.UpdateAnalyzerView( project )
				  return true;
				}

				var DCVTypeLong     = 19
				var DCVTypeDouble       = 20
				var DCVTypeString       = 23
				var DCVTypeTime     = 21
				var DCVTypeTimeSpan     = 22
				var DCVTypeVariant      = 24
				var DCVTypeCustomString = 0x10000000 + DCVTypeString
				var DCVTypeCustomLong   = 0x10000000 + DCVTypeLong

				function UpdateDatacubeA( dc )
				{
				  if( dc == null ) return
				  // Initialization
				  dc.ClearAll()
				  // Define dimensions
				  var dimResource = dc.AddDimension( "Resource", DCVTypeCustomString, "res_rec" )
				  var dimTime = dc.AddDimension( "Time", DCVTypeTime, "" )
				  dimTime.Sequential = true
				  // Root layer element description
				  dimResource.RootLayerElement.Description = "All"
				  dimTime.RootLayerElement.Description = "Entire Period"
				  // Define measures
				  var def = dc.AddMeasureElementDefinition( 1, "Value" )
				  def.ValueType = DCVTypeDouble
				  // Resource layer hierarchy
				  var layerResource = dimResource.PrimitiveLayer
				  var res1 = layerResource.AddElement( "Cutter 1" )
				  var res2 = layerResource.AddElement( "Cutter 2" )
				  var res3 = layerResource.AddElement( "Cutter 3" )
				  // Time layers and layer elements
				  var layerPeriod = dimTime.AddLayer( "Week" )
				  var layerDay = dimTime.PrimitiveLayer
				  var day1 = layerDay.AddElement( VBDateFromLiteral("2016/8/1") )
				  var day2 = layerDay.AddElement( VBDateFromLiteral("2016/8/2") )
				  var day3 = layerDay.AddElement( VBDateFromLiteral("2016/8/3") )
				  var day4 = layerDay.AddElement( VBDateFromLiteral("2016/8/4") )
				  var day5 = layerDay.AddElement( VBDateFromLiteral("2016/8/5") )
				  var day6 = layerDay.AddElement( VBDateFromLiteral("2016/8/6") )
				  // Time layer hierarchy
				  dimTime.RootLayer.AddChild( layerPeriod )
				  layerPeriod.AddChild( layerDay )
				  var periodElem1 = layerPeriod.AddElement( VBDateFromLiteral("2016/8/1") )
				  periodElem1.Description = "Phase 1"
				  var periodElem2 = layerPeriod.AddElement( VBDateFromLiteral("2016/8/4") )
				  periodElem2.Description = "Phase 2"
				  periodElem1.AddChild( day1 )
				  periodElem1.AddChild( day2 )
				  periodElem1.AddChild( day3 )
				  periodElem2.AddChild( day4 )
				  periodElem2.AddChild( day5 )
				  periodElem2.AddChild( day6 )
				  // End of structure definition
				  dc.FinishToSetup()
					// Set data
				  var loc = dc.CreateLocator()
				  SetValue( loc, res1, day2, 0.5 )
				  SetValue( loc, res3, day3, 0.33 )
				  SetValue( loc, res2, day1, 0.1 )
				  SetValue( loc, res2, day5, 1.2 )
				  // End of data setting
				  dc.FinishToBuildData()
				}

				// Set value
				function SetValue( loc, e1, e2, v )
				{
				  loc.SetDimensionLayerElement( e1 )
				  loc.SetDimensionLayerElement( e2 )
				  loc.ObtainMeasure().Value( 0 ) = v
				}
Dynamically Add Submenu from Add-in
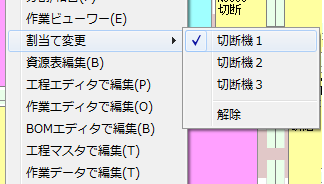
Previously, submenus for add-ins were limited to fixed ones, but now it is possible to determine the configuration dynamically at runtime. For example, you can display a list of candidate resources for operations in a submenu and allow selection. You can also add check marks or disable such submenus.
Other Major Feature Enhancements
Draw Sticky Notes with the Display Color of the Target Object
The background color of sticky notes can now be matched with the color of the target object (such as operations, free calendars, etc.).
Edit Date-Time Markers on Order Gantt Chart and Inventory Level Chart
You can now move date-time markers with mouse operations on the order Gantt chart and inventory level chart. You can change order due dates, order operation period restriction times, inventory receiving and shipping times, and receiving and shipping order times.
Close Tabs with Middle Click / Switch with Wheel Rotation
You can quickly close windows by clicking the middle mouse button (usually the wheel) on a tab. Also, rotating the mouse wheel on a tab switches the active view.
Conditions for Disabling and Hiding Actions
It is now possible to disable actions on objects that meet specific conditions (defined by expressions) or to hide menu items. This allows for descriptions such as "actions targeting only certain resources."
Keyed Values
Previously, records had "keyed real values (= numerical specifications)," "keyed strings (= comments)," and "keyed boolean values (= flags)," but now,Keyed Date-Time Values」「Keyed Time Values」「Keyed Integer Valuescan also be provided, further enhancing the flexibility and efficiency of modeling. Previously, to provide date-time or time, you had to set them as strings (comments) and convert them to expressions at runtime.
Task Multiplicity Key
Previously, task multiplicity was given as a fixed integer value in the BOR, but now it can be specified indirectly using a special key, allowing, for example, the multiplicity to be given as a parameter from individual orders.
Expression Returning Date-Time for Inter-Process Time Constraints
Previously, constraints on the time relationship between preceding and following processes were expressed as "must be separated by n hours." By specifying an expression that returns a "date-time," constraints such as "start after 9 AM the day after the preceding process ends" can be directly expressed. Trying to express the same thing using "time" would make the expression quite complex.
Three Types of FLEXSCHE EDIF Tables
Two export-only tables,Task」「Task Segmentand an update import-only table,Operation Graphhave been added. In "Task Segment," image data in SVG and EMF formats are output. Using "Operation Graph," you can update the properties of existing operation graphs in FLEXSCHE.
