
FLEXSCHE Version 14
FLEXSCHE version 14.0 was released on June 16, 2014. Numerous new features have been added and improvements made. Here are some of the main differences from version 13.0.
FLEXSCHE Analyzer
The production scheduler can be considered a highly modeled virtual factory, and the various data accumulated there can truly be called a "treasure trove." By extracting and analyzing various indicators from it in a multifaceted manner, valuable information for the manufacturing industry can be obtained. This is not only useful for planning operations but also greatly aids in management decisions. The system that provides the means for this is FLEXSCHE Analyzer.
FLEXSCHE Analyzer can be utilized in the following scenarios.
- Analyze long-term equipment utilization rates and on-time delivery rates to assist in making decisions about capital investments.
- Analyze fluctuations in inventory levels and demand to evaluate the appropriateness of safety stock levels set for each component.
- Meticulously aggregate manufacturing costs and production lead times for each item to reflect them in the product mix plan.
- Analyze the setup occupancy rate and equipment utilization rate in facilities to aid in on-site improvements.
- Quantify delays and waste in processes to aim for better planning.
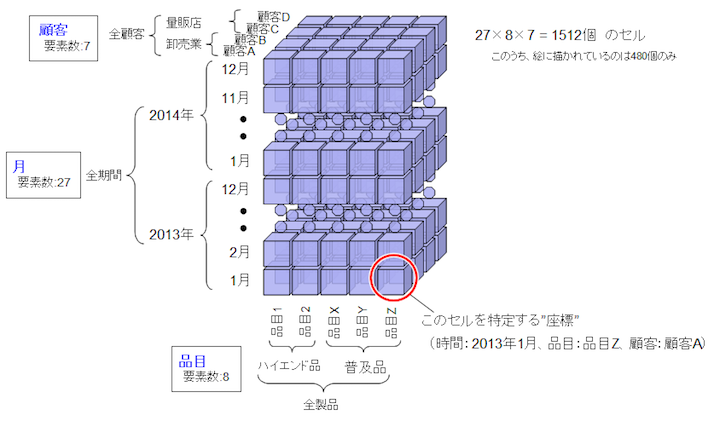
In FLEXSCHE Analyzer, data within FLEXSCHE is first collected to generate a "data cube (hierarchically structured multidimensional data)." Users can freely define the method of generating the data cube using "takt expressions." In the "data cube viewer" for viewing the generated data cube, you can specify the axes to be displayed and open or close data hierarchies, allowing you to efficiently grasp vast amounts of information from multiple perspectives.
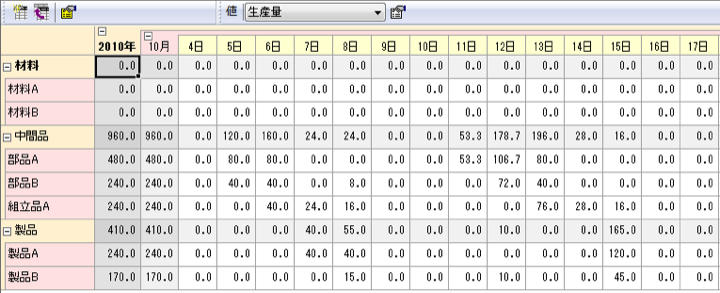
* Additionally, instead of a data cube, you can generate a dataset (table-formatted data)
to reference from scheduling rules or export to a file.
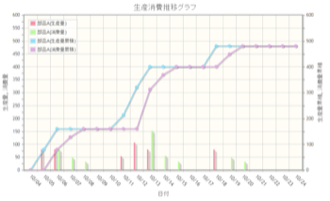
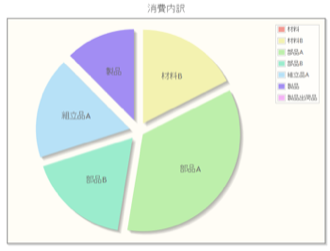
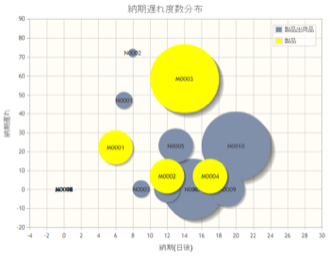
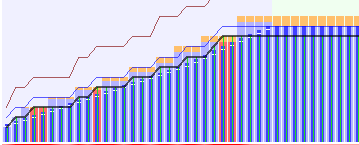
Furthermore, you can specify any axis and range from the data cube to extract values and create graphs. The graphs that can be created with FLEXSCHE Analyzer 14.0 include the following.
- Line Graph
- Vertical Bar Graph/Horizontal Bar Graph
- Pie Chart
- Bubble Chart
- Scatter Plot
- Radar Chart
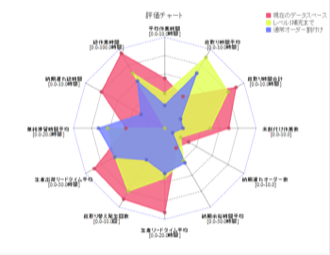
You can easily create radar charts (referred to as "evaluation charts") for the following pre-prepared evaluation indicators. You can also overlay multiple scheduling results, which can be used for tuning scheduling rules.
Average Operation Time / Average Setup Time / Total Setup Time / Number of Unassigned Operations / Number of Overdue Orders / Average Due Date Margin Time / Average Production Lead Time / Number of Changeover Occurrences / Average Production Shipping Lead Time / Average Simple Idle Time / Total Overdue Time / Total Operation Time
You can freely rewrite this as a basis.
Graphs can be viewed on the FLEXSCHE screen, but since they are created as HTML5 files, they can also be viewed in a web browser and printed.
FLEXSCHE Analyzer is an optional product.
FLEXSCHE GUI
Operation Marker
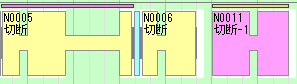
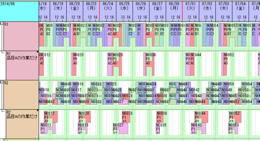
It is now possible to display markers according to conditions in the gap above the task bar display of the resource Gantt chart. You can choose between simple settings similar to the conventional "highlight display" of operation display colors and advanced settings using conditional expressions. The color of the markers can also be specified flexibly. Specify in [Chart Display Settings] - [Resource Gantt Chart] - [Operation Marker].
Chart-Specific Display Timerange Limitation
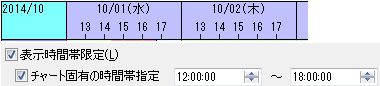
Previously, the specification of display timerange limitation was only common for the entire project, but now it is possible to specify individual display timerange limitations for each chart. Specify in [Chart Display Settings] - [Entire Chart] - [Time Axis] - [Chart-Specific Timerange Specification].
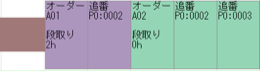
Target Part Limitation in Load Chart
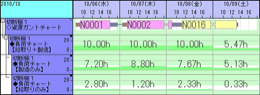
It is now possible to select the target part for aggregation in the load chart. You can exclude setups from the aggregation target or, conversely, aggregate only setups.
Preset Values for Chart Holiday Settings
![]()
To accommodate overseas use, it is now possible to specify chart holiday settings with an external file. If you set the holidays of that country in advance, they will be automatically reflected as holidays in the chart.
Conditional Formatting Strings
Added "case division" to the display strings of the resource Gantt chart and order Gantt chart, allowing the displayed strings to be switched according to conditions. For example, if the information you want to see differs for each operation, you can display strings corresponding to that.
Project Protection and Duplication
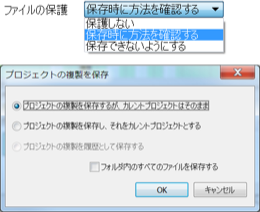
To prevent projects from being inadvertently saved, it is now possible to protect files. You can choose from "Do not protect," "Confirm when saving," or "Prevent saving." In addition to the conventional "overwrite save," it is now possible to save a duplicate of the project.
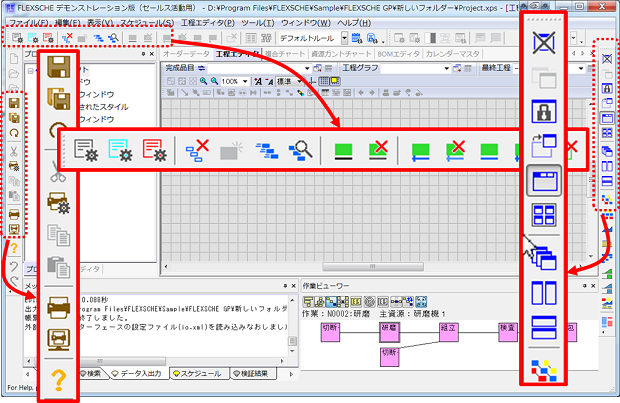
Tool Buttons Changed for High Resolution
The size and design of tool buttons have been revamped to make them easier to operate even in high-resolution environments. The design of the timeline chart drawing has also been refreshed for a cleaner look.
Hide Operations in Resource Gantt
It is now possible to hide operations in the resource Gantt chart according to conditions. By setting display conditions, you can achieve a neat display even when there are many operations, such as narrowing down to specific order items.
Modeling & Scheduling
Temporary Process Relation
A mechanism has been added to import external BOM data that does not have process connection information as is. The imported BOM information is displayed on the process editor, allowing it to be immediately processed into data necessary for the scheduler. It can be used for data linkage with general production management systems.
Key Specification in Key Wait
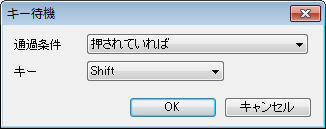
It is now possible to specify the type of key in the key wait of the execute commands method.
Changeover by Numerical Specification
In changeovers due to attribute changes between preceding and following operations on a resource, it was previously possible to select "Item," "Sub-Resource," "Spec," and "String" as attributes, but now "Numerical" can also be selected. For example, it is easy to set "Setup time when switching from narrow to wide width."

Enhanced Squad Resource
The functionality of the advanced option "Squad Resource" has been further enhanced, allowing the maximum resource quantity (number of people) per squad for each operation and the minimum resource quantity per squad member to be specified using expressions.
Define Variables in Rules
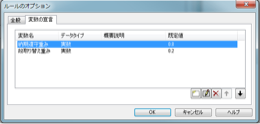
It is now possible to define variables in scheduling rules. By parameterizing the parameters used during scheduling, it becomes possible to compare the results of executing a single rule with different parameters, enabling planning.
FLEXSCHE Editor
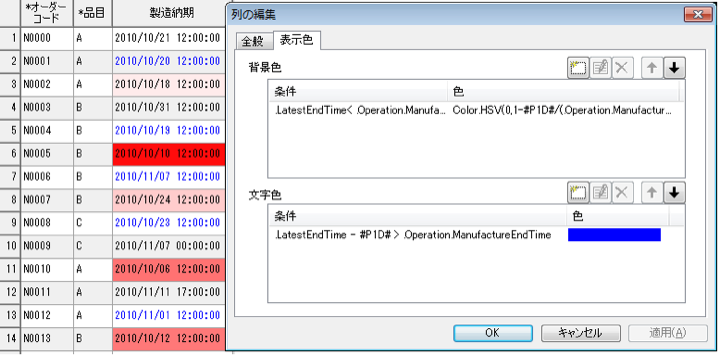
Cell Text Color and Background Color
It is now possible to freely set the text color and background color of cells. Colors are reflected in real-time. Specify in [Various Data Window Top Menu] - [Column Settings] - [Edit Column] - [Display Color].
FLEXSCHE EDIF
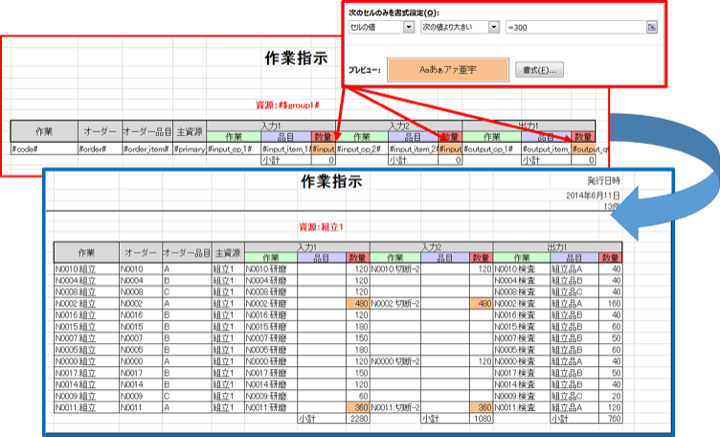
Excel Report Supports Conditional Formatting
It is now possible to embed conditional formatting in layout definition files. This is reflected in the generated Excel report files.
FLEXSCHE d-MPS
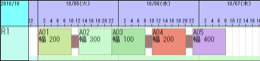
Visualization of Disposal Quantity
The disposal quantity due to the consumption expiry function (advanced option) is now drawn in orange in the MPS editor. In FLEXSCHE d-MPS, disposal is reflected as a decrease in supply quantity.
Select Operations Corresponding to Daily Production Quantity and Daily Production Demand Quantity
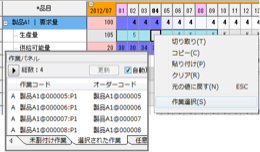
Added [Operation Selection] to the popup menu of the daily production quantity and daily production demand quantity cells, allowing you to select operations to produce or consume the specified quantity. Additionally, the selected operations are immediately listed in the "Selected Operations" of the operation panel.
Fluctuation-Keeping Proportionate Division of MPS Daily Demand Quantity
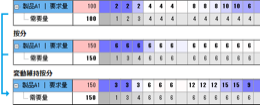
Implemented "Fluctuation-Keeping Proportionate Division" and "Automatic Fluctuation-Keeping Proportionate Division" for daily demand quantities. The traditional "Proportionate Division" function completely resets and redistributes the targeted daily demand quantities, causing any adjustments made to be lost. "Fluctuation-Keeping Proportionate Division" allocates the increase or decrease according to the current variation, ensuring previous adjustments are not wasted. Furthermore, by setting "Automatic Fluctuation-Keeping Proportionate Division" in the MPS calendar, it will automatically execute when the monthly demand quantity or monthly requirement quantity changes.
Other
Data Integration with TPiCS-X Ver4.0
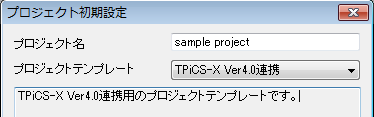
Prepared a project template for integration with the production management system TPiCS-X Ver4.0 by TPiCS Laboratory Inc. It includes various settings (such as rules) for directly importing or exporting data from the TPiCS database via EDIF. Select the template when creating a new project.